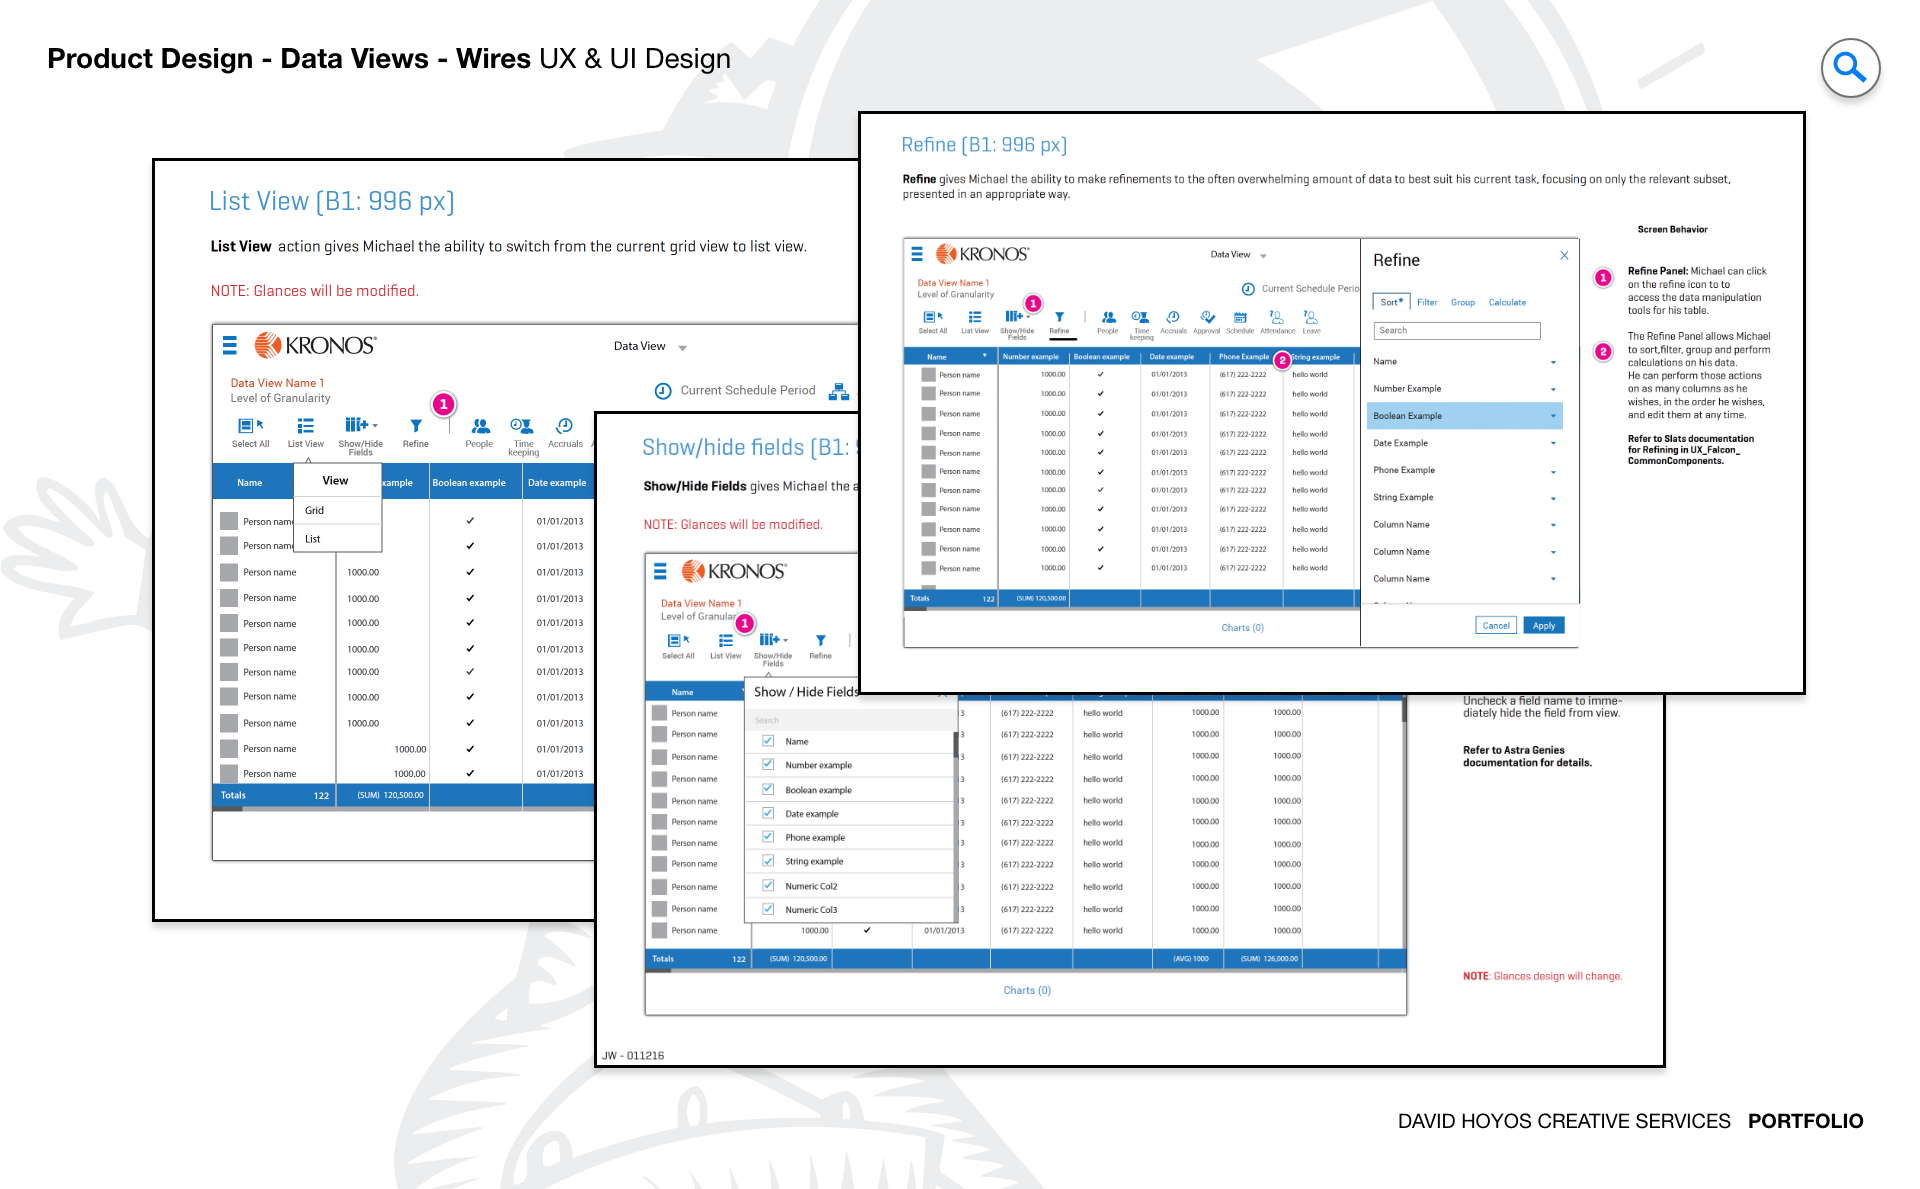
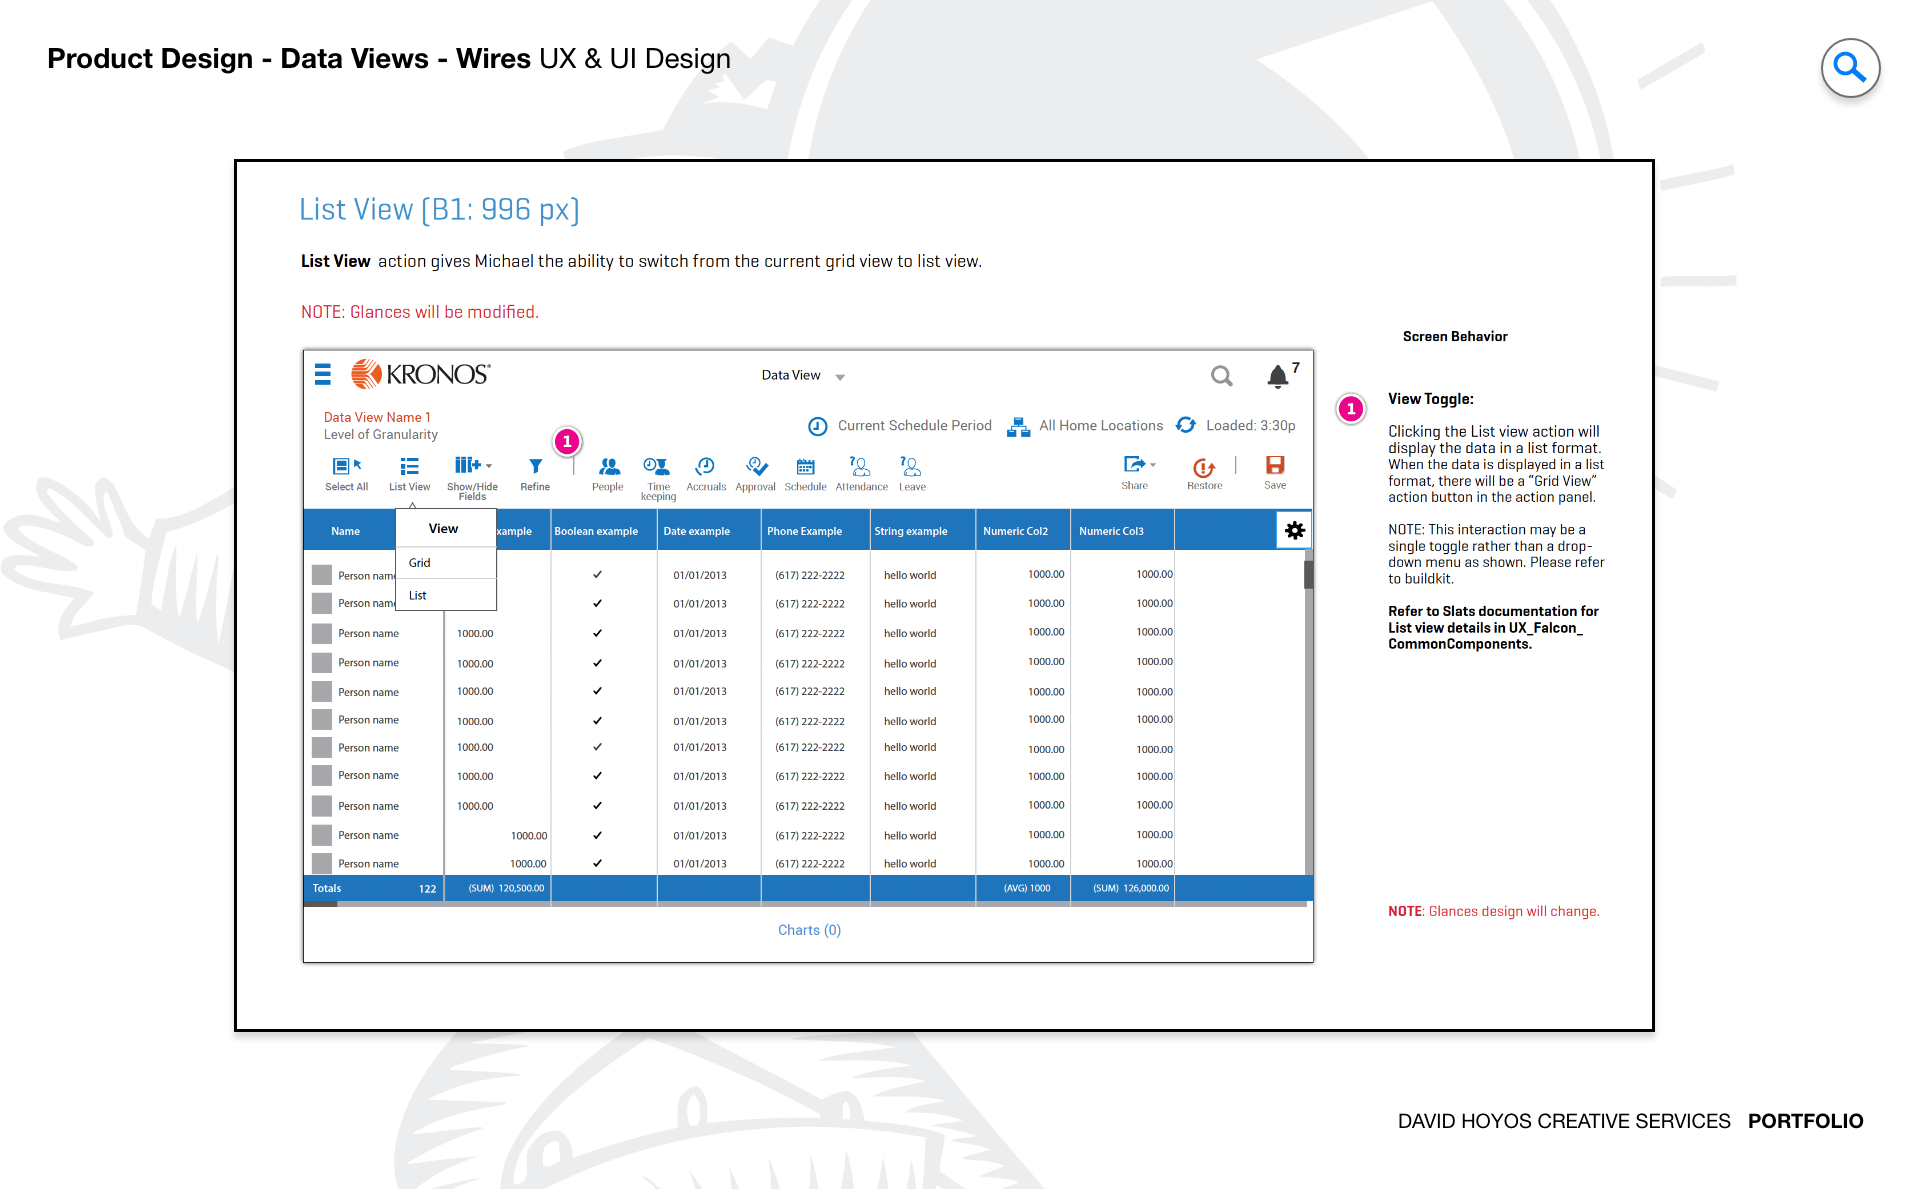
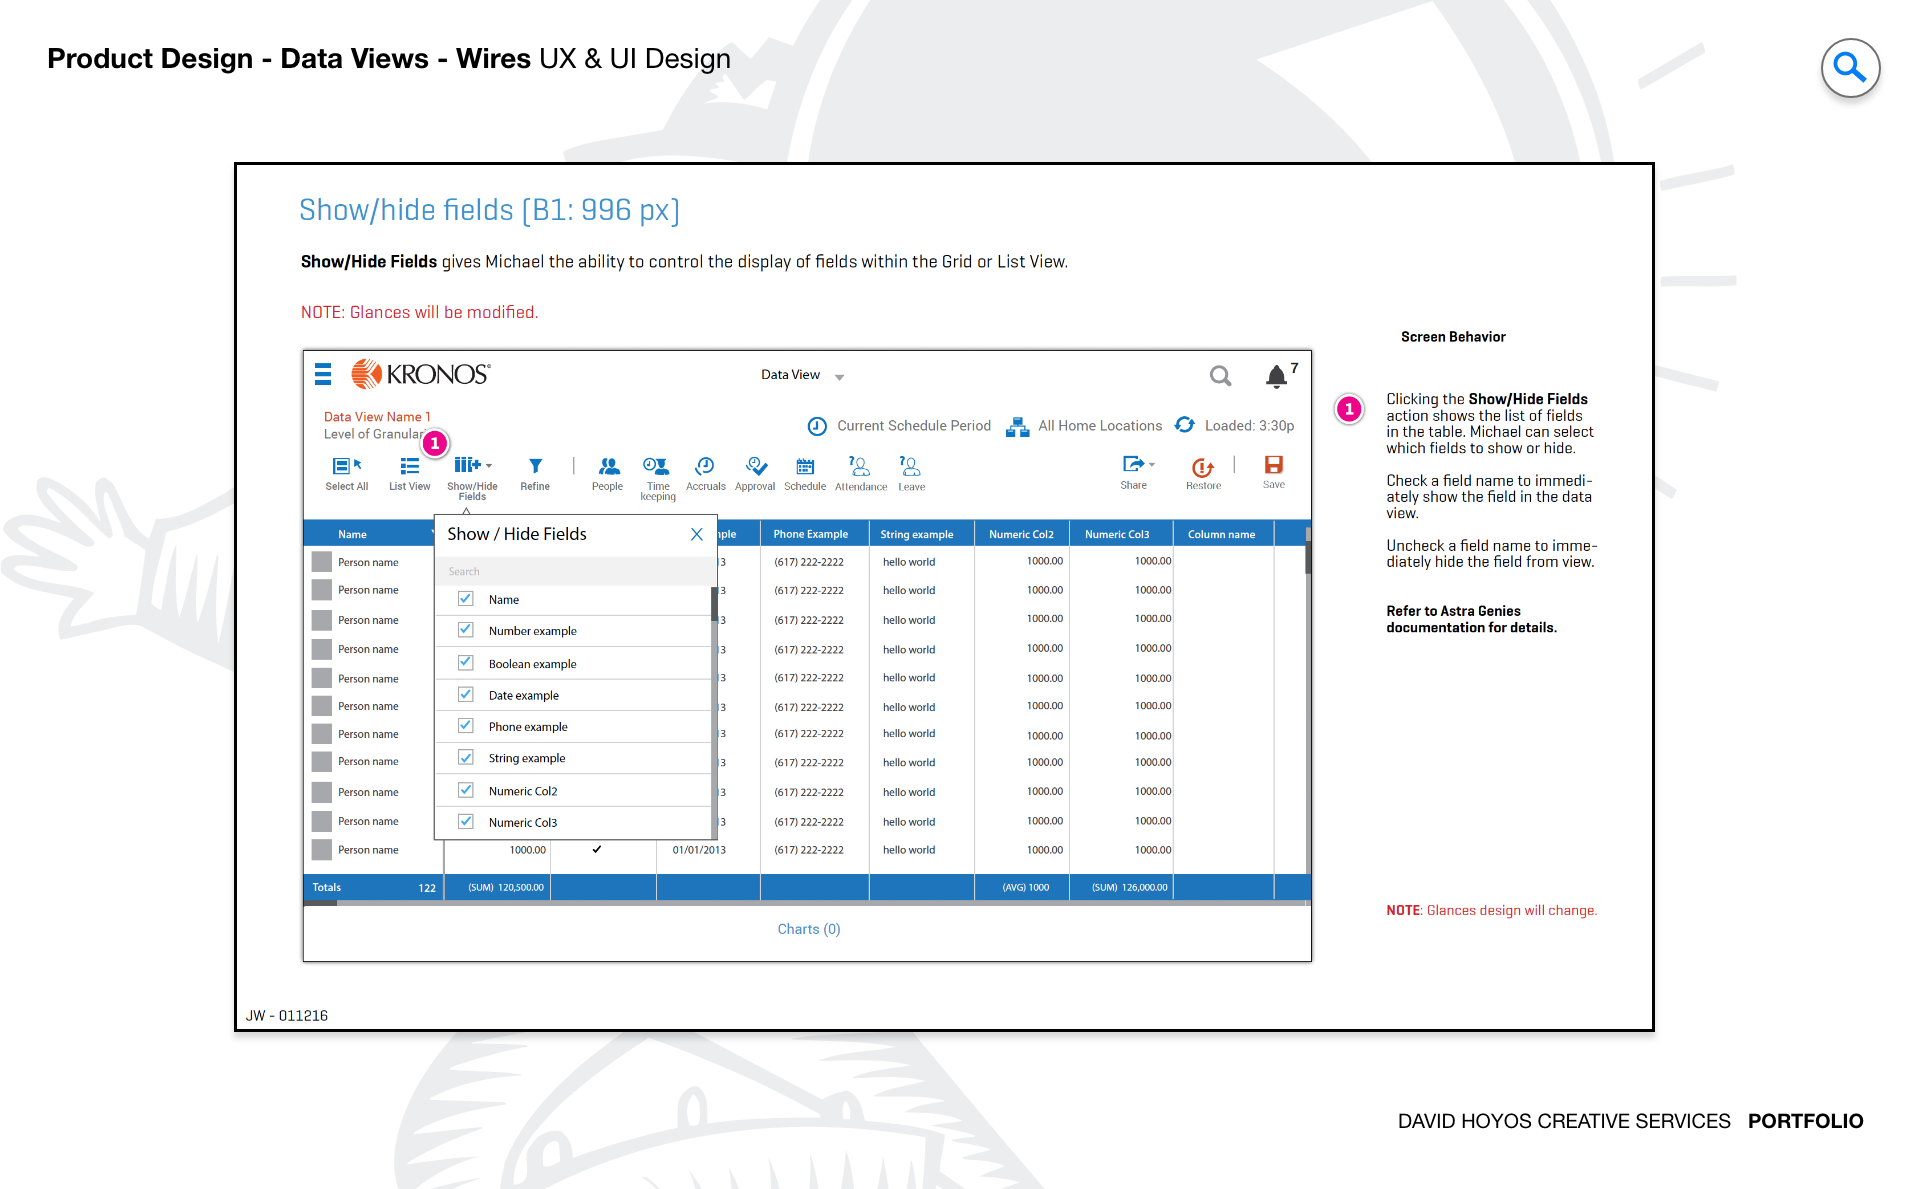
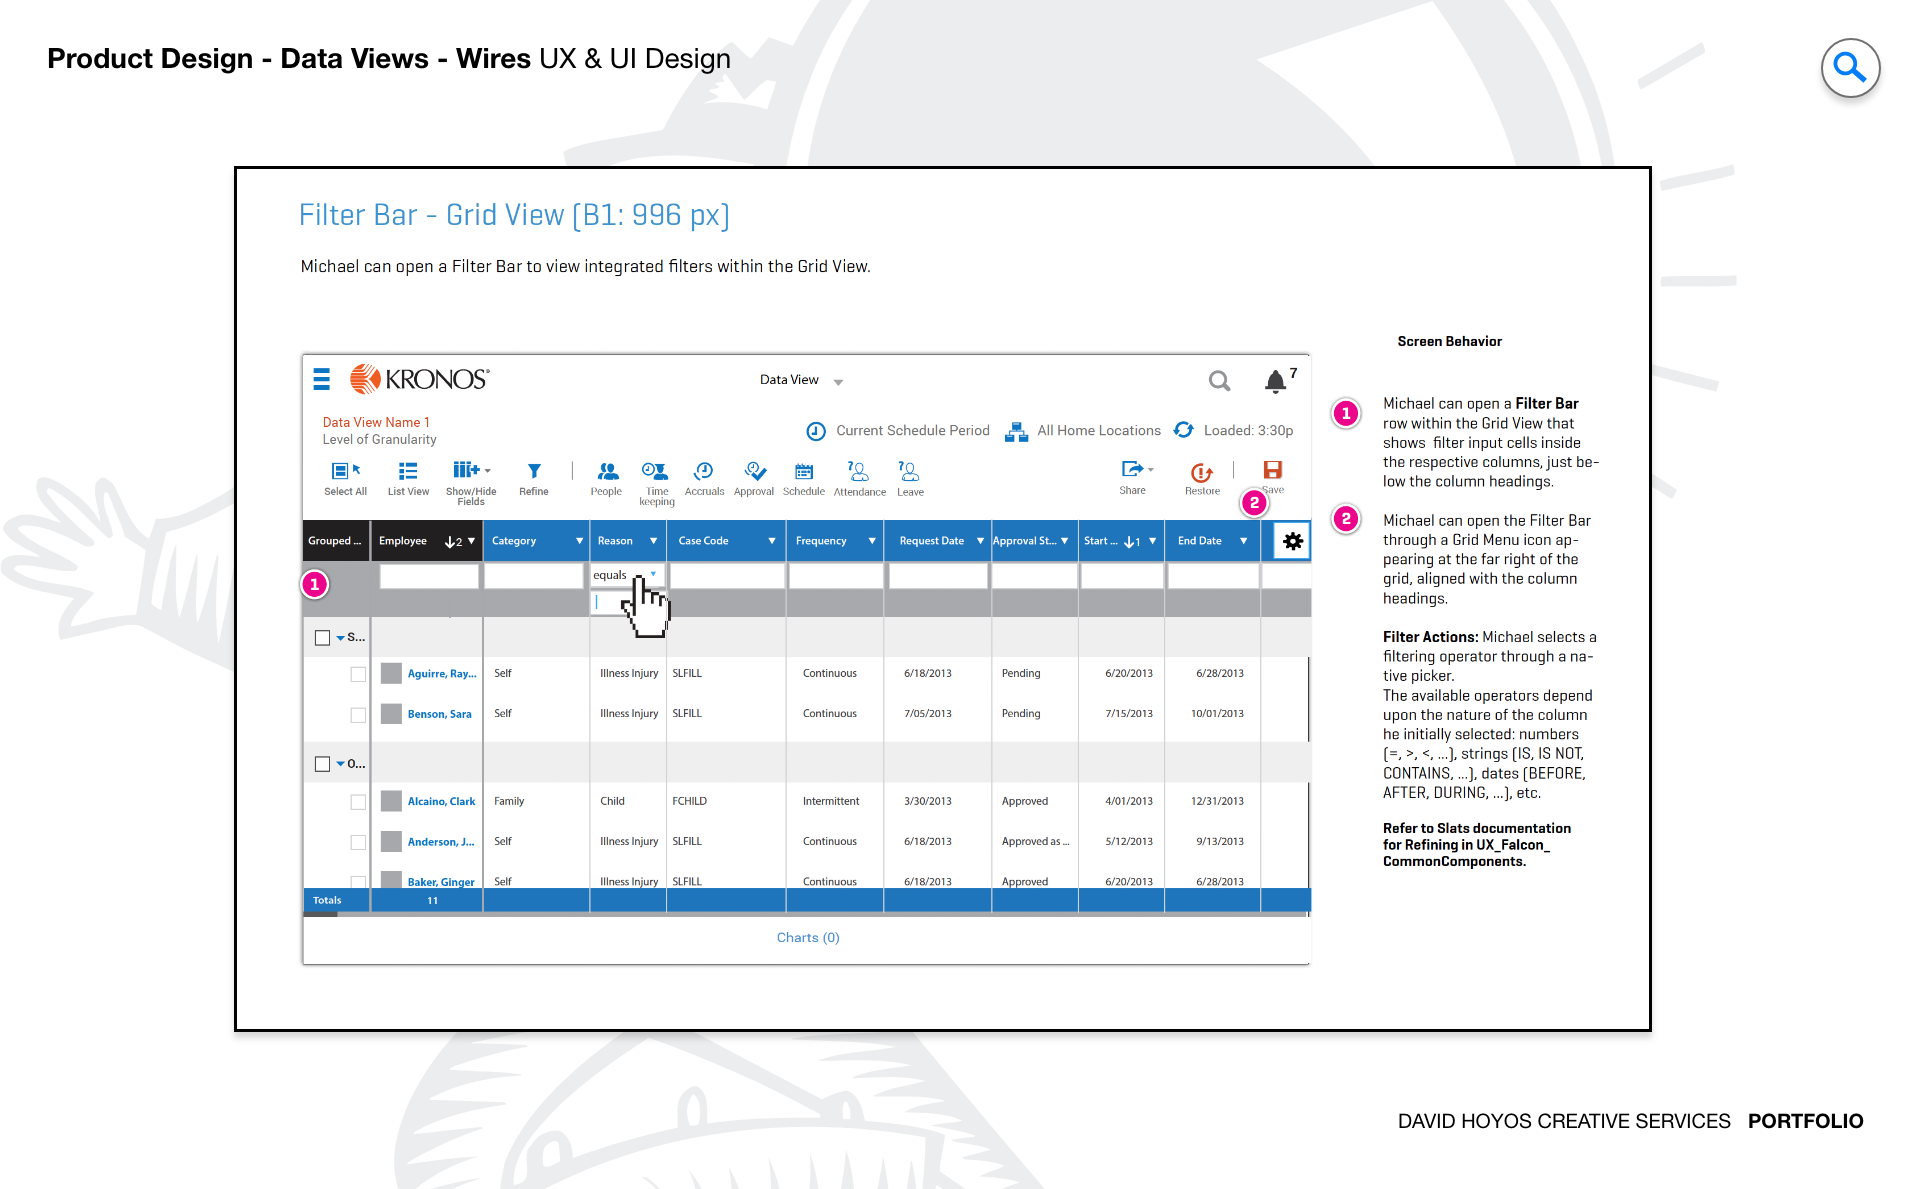
PROJECT Dataviews Dataviews is a grid system and multi-view data display framework designed to handle the kind of data loads that enterprise workforce management actually generates. The project established the design patterns for how managers interact with large, structured data sets across the platform: a primary grid with rich controls for sorting, grouping, filtering, and contextual actions, alongside alternative view formats that serve different operational needs without abandoning the underlying data model. The work was foundational in nature — a component and pattern system rather than a single screen — which meant the decisions made here would shape how data was presented across the entire product. The scope stretched from interaction design through full production and deployment, making it one of the more complete engagements in the portfolio. Getting data views right is a precondition for getting most other things in an enterprise product right, because nearly every manager-facing workflow eventually surfaces in a list or a grid. The investment in building a robust, flexible system at this layer paid forward into every feature that relied on it. OBJECTIVE The objective was to design a grid system and a set of alternative view types that gave managers a genuinely capable environment for working with large, complex data sets. A grid that supports sorting, grouping, filtering, and contextual menus is not just a display component: it is an operational tool that managers use to find information, act on it, and understand patterns across their teams and locations. The design had to make all of that capability accessible without burying it behind complexity that slowed users down. Alternative views extended the system beyond the grid. Different data sets call for different representations: a list that works well for reviewing employee records is not necessarily the right format for understanding coverage gaps across a week. Designing view alternatives that were contextually appropriate and easy to switch between gave managers the flexibility to approach their data from the angle that made the most sense for the decision they were trying to make, without requiring them to navigate away from their current context. CHALLENGE Data density, touch targets, vertical space.. Data density was the defining constraint. A manager reviewing scheduling data across dozens of employees, multiple locations, and an extended time range is looking at a table that wants to be very wide and very tall at the same time. The design had to find the right balance between showing enough information to be useful and producing a view so dense it required constant horizontal scrolling to navigate. Every column, every row height, and every typographic decision in the grid had direct consequences for how much a manager could take in at once and how quickly they could find what they were looking for. Touch targets introduced the second layer of complexity. Enterprise software grids are typically designed for mouse and keyboard, where precision is essentially free. On touch devices, and this platform served users across desktop, tablet, and mobile, a grid that works at desktop density becomes nearly unusable without deliberate attention to the size and spacing of interactive elements. Rows compact enough to display meaningful data on a desktop had to remain tappable on a tablet, and the controls for sorting, filtering, and contextual actions had to be reachable without requiring exceptional accuracy from the user. Vertical space was the quietest but most persistent challenge. Every row in a grid competes for vertical real estate with every other row, and a grid that uses too much vertical space per row means the manager can see fewer records without scrolling. Too little space per row produces a dense, hard-to-read wall of information. Finding the right vertical rhythm — compact enough to maximize the visible data set, open enough to remain readable and tappable — was one of the most iterative problems in the project, settled only through testing with real data and real users. PERSONA(S) Manager The manager is the primary audience for data-heavy views in this platform, and the grid system was designed around how managers actually think about and use data in their operational context. A manager reviewing timekeeping data is looking for exceptions: the record that does not match expectations, the employee whose hours are off, the department where coverage is short. They are not reading every row; they are scanning for signal, and the design had to support that mode of use by making visual hierarchy, sorting logic, and filtering accessible enough to be part of a routine workflow rather than a specialized skill. The manager persona also encompasses a wide range of technical comfort with data tools. Some managers use grids like power users, building complex multi-level sorts and grouped views that give them a specific analytical angle on their data. Others need a simpler interface: a clean list, a sort button, and a way to find one record without setting up a filter. The grid system had to serve both ends of that range without making the simpler experience feel limited or making the advanced capabilities feel hidden. INDUSTRY Retail, manufacturing, healthcare, hospitality, sales & distribution, government. Six industries, each generating different types of structured data and each placing different demands on the grid system's flexibility. In retail, managers are frequently reviewing coverage and scheduling data that changes rapidly, and the ability to sort and group by location, shift, or role is essential to staying on top of a large, fluctuating workforce. In manufacturing and healthcare, the data often carries compliance and safety implications, and the grid's filtering and grouping capabilities had to support the kinds of focused queries those environments require: who is certified, who is scheduled, who has completed required training. In hospitality, the irregularity of demand-driven staffing means the data sets are often uneven, placing a premium on grid controls that helped managers impose order on complex, shifting information. In sales and distribution and government, the scale of the user base and the geographic distribution of the workforce meant that managers were often working with data sets large enough to make performance a design consideration as much as an engineering one. A grid that renders gracefully at a thousand rows and a grid that handles ten thousand are different design problems, and the system had to account for the full range of organizational sizes the platform served across these industries. PROCESS Assessment + Exploration + Design + Production + Deployment Assessment began by auditing how data was currently being presented across the platform and how managers were working around its limitations. Grids that lacked grouping forced managers to export data to spreadsheets for analysis they should have been able to do in the tool. Filters that were hard to access meant managers were scrolling through long lists to find records they should have been able to surface in two steps. The audit created a clear picture of the gap between what the data presentation layer was doing and what managers actually needed it to do, and it made the design priorities self-evident. Exploration tested the range of possible grid architectures: how columns were organized and resized, how grouping and sorting interacted, how contextual menus were surfaced without cluttering the view, and how alternative views were triggered and navigated. The presence of a software architect in the team at this stage was significant: exploration that looked promising from a UX standpoint was continuously evaluated for technical viability, which kept the design from pursuing directions that would have been costly or architecturally difficult to build. Production brought the approved designs into buildable specificity, and deployment completed the cycle by validating the system in real use before it was released broadly across the platform. DELIVERABLES Wires, HIgh-Fidelities, BuildKit. Wireframes at the grid system level are structural documents more than layout sketches. They specify how the grid responds to different data densities, how column headers behave when sorted or grouped, how filters interact with the visible data set, and how alternative views maintain context when a manager switches between them. The wire phase was where the interaction logic was settled in enough detail that the visual design phase could build on it without relitigating structural decisions that had already been resolved. High-fidelity designs applied the visual language of the product suite to the grid system, including the typographic hierarchy, color semantics for status and state, and the visual treatment of selected, hovered, and active rows. The BuildKit gave engineering the documented component system needed to implement the grid with the precision that infrastructure-level work requires: every state, every interaction, and every edge case specified and delivered alongside the assets needed to build it without ambiguity TEAM UX + UI + Research + Front-end Developer + Software Architect + PM UX, UI, Research, a Front-end Developer, a Software Architect, and Product Management. The team structure for this project reflected the foundational nature of the work. A grid system is not a feature; it is infrastructure, and infrastructure decisions benefit from having engineering at the table from the beginning. The front-end developer and software architect participated in exploration and design reviews, which meant technical constraints shaped the design before they could become obstacles, and the design shaped the implementation approach before engineering had locked in patterns that would have been difficult to revisit. Research contributed the usage data and behavioral insight that grounded the design in how managers actually worked with data rather than how they were assumed to. The presence of all six functions in the core team made this project more aligned and more efficient than a phased hand-off approach would have been, and the quality of the final system reflected that integration across every phase from exploration through deployment. ROLE Creative and design direction (UX/UI). Creative and design direction across UX and UI. At the creative direction level, that meant establishing the design vision for what a capable, well-designed enterprise grid could look like in this product: not a generic data table borrowed from a component library, but a system that reflected the specific operational context of workforce management and the specific users who depended on it. That vision had to be clear enough to align a six-person team across a long, multi-phase project without becoming a constraint that made iteration difficult. At the design direction level, the role meant driving decisions across both UX and UI, from the structural logic of how the grid handled sorting and grouping through to the visual precision of how state and status were communicated in a dense, information-rich environment. Directing both disciplines on a single project is an advantage when the component being designed lives at the intersection of structure and appearance the way a data grid does, because the decisions are genuinely inseparable: a sorting affordance that is structurally sound but visually ambiguous is not finished, and a row height that is visually elegant but too small to tap is not usable.